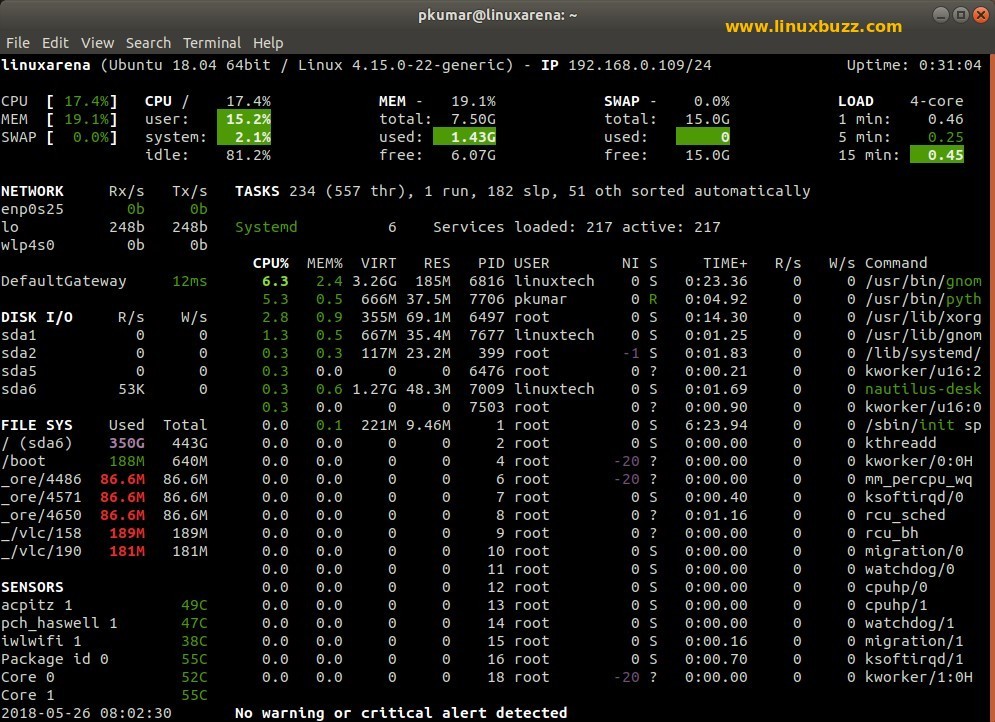
If you are looking to monitor your Linux server’s performance including its CPU usage, memory, disk I/O, processes running and many other important information about your servers, then you need to seek the help of some third party tool to do the job. And Glances Tool does an amazing job in providing you upto date details about your server in a timely manner.
So what is this Glances Tool all about?
Glances is free command-line based cross-platform tool that is completely text based that helps you to monitor your Linux servers effectively. Written in Python, the tool utilizes the psutil library to retrieve the information from your servers. With this tool you can easily monitor all your server information including Average load, File System, information on the mounted devices, cpu usage, memory, disk I/O along with the processes running in the server and many more. The tool also provides you with various options that you set the threshold in a config file to alert you when the threshold is reached.
What can be monitored with Glances?
With the help of Glances Tool, you can certainly keep a tab on every important information about your server including:
- CPU Usage – Displays the total CPU usage shown in percentages including the user, system and idle CPU usage.
- Memory Usage – The information on memory usage is displayed in two columns, one for Ram and one for SWAP usage
- Network – Display the network interface bit rate in units that changes automatically in bit/s, kbit/s, Mbit/s etc.
- Disk I/O – The input/output (I/O) operations of each disk in the server is displayed separately and the units are changed dynamically.
- File System – Displays the information about the total used and total available disk space and the unit changes dynamically
- Process – The Process information of your server is displayed in 3 different sections including the processes summary, monitored processes list and processes list.
Glances Color Codes
The Glances Tool provides you option to set the color codes according to your needs and these color codes alerts you immediately if there is something that needs to be addressed immediately. The default color codes in Glances are:
- Green -> Means everything is OK
- Blue -> Need to be Careful
- Violet -> Not Critical, but needs your attention
- Red -> Extremely Critical and Immediate attention required
Commands to Fine Tune your Output in Glances
Glances provides you with several interactive commands to fine tune your output according to your requirements:
- a – Sort processes automatically.
- b – Bytes or bits for network I/O.
- c – Sort processes based on CPU usage
- d – Show/hide disk I/O stats.
- e – Show/hide extended stats shown on top
- f – Show/hide file system information
- g – Show graphs for the current history
- h – Show/hide help information
- i – Sort processes by I/O rate.
- l – Show/hide logs.
- m – Sort processes by MEM%.
- n – Show/hide network stats.
- p – Sort processes by name.
- q – Quit Glances tool
- s – Show/hide sensors stats.
- t – View network I/O as combination.
- u – View cumulative network I/O.
- w – Delete warning logs.
- x – Delete warning and critical logs.
- Z – Show/hide process stats
- 1 – Global CPU or per-CPU stats.
Install Glances on Debian/Ubuntu & CentOS7 / RHEL 7 Servers
To install Glances in Linux Ubuntu, run the following command:
pkumar@linuxarena:~$ sudo apt-get install glances
To Install glances on CentOS 7 / RHEL 7 Servers, run the beneath commands,
Note: On RHEL servers, first you need you enable Extra Packages for Enterprise Linux and for CentOS Servers, enable EPEL repository
# yum install epel-release -y
# yum install glances -y
How to start glances?
Once you’ve successfully installed Glances, you just need to type the following command to start using Glances
pkumar@linuxarena:~$ glances
In Glances tool, by default refresh interval time set as 1 second , if you want set its a specific interval then use -t option followed by seconds
pkumar@linuxarena:~$ glances -t 4
Access Glances using Web Browser
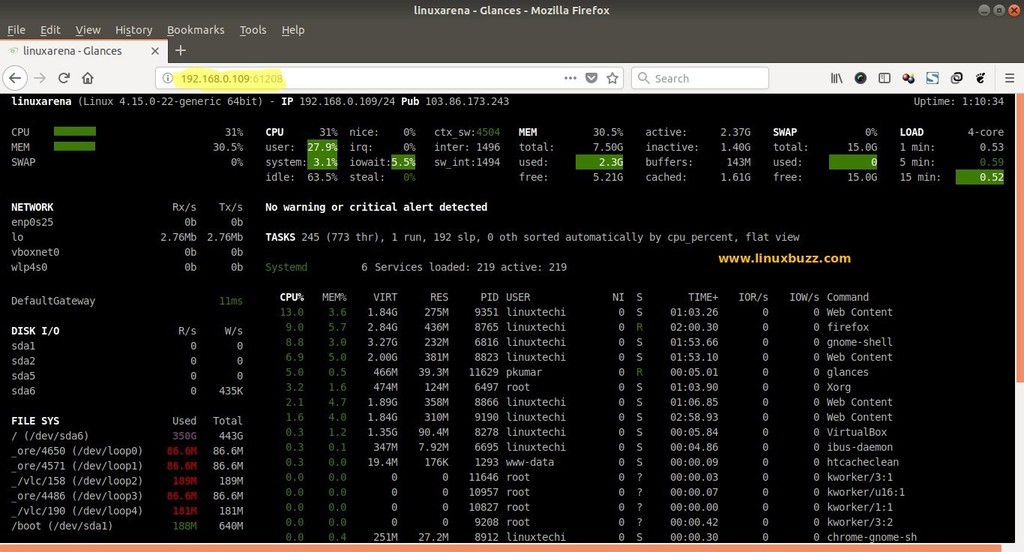
Glances tool can also be used via Web Browsers, but first you need run the below command on terminal,
pkumar@linuxarena:~$ glances -w
Glances web server started on http://0.0.0.0:61208/
Now Access the Glance Web Server in your System Web Browser, Use the IP address of machine, in my case it is “192.168.0.109”
Export Glance System Statistics
Yes, you can export all your glance system statistics into CSV, RabbitMQ, Cassandra, InfluxDb, StatsD and many more to further analyse the data.
To export the statistics to a csv file, run the following command
pkumar@linuxarena:~$ glances --export-csv /tmp/glances.csv
Glances Client-Server setup
Glances tool supports client-server architecture too, to use this setup, we will require one client machine with glances tool installed on it and remote System or servers which we want to monitor via glances client. We have to install glances tool on each remote server and have to start it in server mode.
On each remote server run the beneath command,
# glances -S
Now from the glances client machine, connect to these remote server via their ips.
# glances -c -P {Remote-Server-IP}
Please make sure glance server port “61209” opened on firewall, In case it is enabled in your setup.
Conclusion
Glances is a must-have tool for every Linux system admins out there as it helps you to monitor your server easily and the color codes help in identifying any critical issues quickly. If you any queries or suggestions, please feel free to provide your comments below and we’ll try to revert back at the earliest possible.

